Why 'Reliable' Is Not a Single Number
When a car is described as reliable, that word is doing a lot of heavy lifting. Depending on the source, it could mean the vehicle scored well in a subscriber survey, had a low warranty claim rate in its first year, or simply hasn't generated many complaints on owner forums. These are related but meaningfully different things.
Reliability data generally falls into three categories: owner surveys, which ask drivers to report problems they experienced; warranty and repair records, which track claims submitted to manufacturers or independent shops; and long-term road tests, which involve professional evaluation over extended mileage. Each captures a different slice of the picture. Owner surveys are broad but subjective. Warranty data is objective but incomplete - it only covers repairs done under warranty, and owners who pay out of pocket don't appear in those numbers.
Understanding which type of data you're looking at before drawing conclusions is the first step toward using reliability information well. For context on how aggregate scores of any kind can mislead, see our guide to interpreting star ratings.
~150
Problem categories tracked in major owner surveys
Large consumer reliability surveys typically track problems across roughly 150 vehicle attributes, ranging from powertrains to interior controls, according to published survey methodology descriptions.
3 years
Typical owner survey coverage window
Most major owner-reported reliability surveys capture data from the first one to three years of ownership, which may not reflect how vehicles perform at higher mileage.
1 in 3
Redesigned models with elevated first-year problem rates
Industry analysts have observed that vehicles in their first model year after a major redesign frequently show higher-than-average problem rates as new systems are refined.
What Owner Surveys Measure - and Miss
Owner surveys are the most widely cited reliability source in consumer car research. Organizations collect responses from vehicle owners asking how many problems they experienced across defined categories - engine, transmission, infotainment, climate control, and so on. Results are typically expressed as problems per 100 vehicles: a lower score indicates fewer reported issues.
These surveys are valuable because they reflect real-world driving, not controlled test conditions. However, they carry important limitations. First, respondents self-select, which can skew results toward owners with strong opinions - either very satisfied or very dissatisfied. Second, what counts as a "problem" varies: one driver may report a slightly stiff key fob as an issue while another ignores a minor engine hesitation. Third, surveys typically capture early ownership experience, often within the first one to three years, which may not predict how a vehicle holds up at 100,000 miles.
For a broader look at how crowdsourced opinions compare to structured testing, our article on crowdsourced opinions vs. expert testing explores that tension in detail.
“Reliability data tells you about the past performance of a specific configuration - it's a starting point, not a guarantee. The most informed buyers treat it as one input in a broader evaluation, not the final word.”
— Consumer automotive research analysts, General guidance from published automotive research literature
Model Year and Trim Level Matter More Than You Think
A common mistake is treating a vehicle's reliability reputation as fixed. In practice, reliability data is specific to a model year - and sometimes to a specific trim or powertrain configuration. A nameplate with a strong ten-year track record may have introduced a newly redesigned transmission in its latest generation, creating a higher problem rate for that year alone.
When a manufacturer introduces new technology - hybrid systems, dual-clutch gearboxes, turbocharged engines replacing naturally aspirated ones - problem rates often rise before manufacturing and software issues are resolved. Conversely, a model that carries over largely unchanged from a prior year frequently inherits proven components with well-understood failure points.
This is why checking data at the model-year level, not just the nameplate level, is essential. If a vehicle is in its first or second year of a significant redesign, historical reliability data for earlier generations offers limited predictive value.
How Warranties Fit Into the Reliability Picture
A manufacturer's warranty signals something about confidence in the product, but it isn't a substitute for reliability data. A longer powertrain warranty, for example, shifts financial risk from the buyer to the manufacturer - it does not mean the powertrain will never need repair. Coverage terms vary significantly: what is covered, for how many years or miles, and what conditions can void coverage all differ across manufacturers and programs.
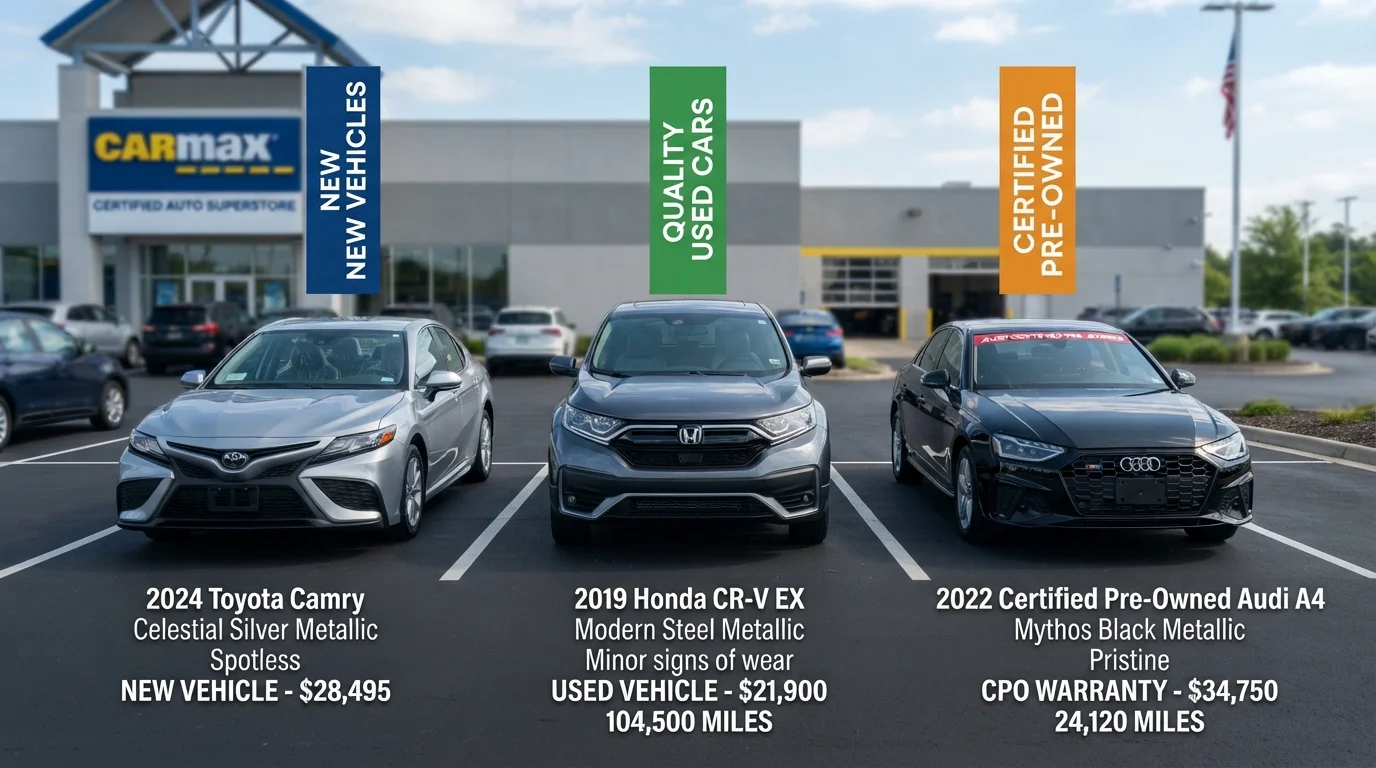
For buyers considering used vehicles, the relationship between warranty and reliability gets more nuanced. Certified pre-owned (CPO) programs typically include an inspection and an extended warranty, reducing near-term repair exposure. But the underlying vehicle's historical problem rate still matters, especially for ownership beyond the CPO coverage period. Our breakdown of new, used, and CPO protections can help clarify what each label actually guarantees.
Financing decisions are also tied to reliability in a practical way: a vehicle with higher expected repair costs may change your total cost of ownership calculus significantly. Thinking through those numbers before signing is worth the effort - our financing a car hub covers the loan and cost-planning side of that equation.
Building a More Complete Reliability Picture
No single data source tells the full story. A practical approach combines at least two or three of the following: owner survey data for the specific model year and powertrain you're considering; independent long-term test results from automotive publications that have driven the vehicle extensively; and repair cost data from independent mechanic databases, which can reveal how expensive problems are when they do occur - not just how often.
Pay attention to which categories show elevated problem rates. An infotainment glitch is aggravating; a transmission issue is expensive. Some data providers break down scores by category, which allows you to weight problem areas according to your priorities. A driver who uses voice navigation constantly will weigh a high infotainment problem rate differently than one who rarely engages those systems.
Finally, keep reliability in context with safety data. A vehicle can score well on reliability surveys while underperforming in crash protection - or vice versa. For a parallel look at how safety scores are structured and what they actually test, see our article on NHTSA and IIHS safety ratings.
This article is for general informational and educational purposes only. It does not constitute financial or purchasing advice tailored to your individual circumstances. Consult qualified professionals as appropriate before making significant financial decisions.