
Why Most Product Comparisons Fail
The typical approach to comparing products looks like this: open several browser tabs, scan bullet points, check a star rating, then choose based on whichever page felt most convincing. That process is largely random - it measures marketing quality more than product quality.
The problem isn't effort; most people spend real time on major purchases. The problem is structure. Without a defined set of criteria evaluated consistently across candidates, comparisons degrade into feature-count contests where the product with the longest spec sheet wins by default.
A structured framework fixes this by forcing you to decide what matters before you're exposed to any product's particular strengths. It separates the question of what you need from the question of which product delivers it. This article gives you a repeatable process that works across categories - whether you're evaluating appliances, electronics, vehicles, or any other significant purchase.
For decisions that involve understanding technical documentation, see our comprehensive guide to researching any major purchase for a broader framework that complements this one.
Anchor to Needs, Not Marketing
The single biggest trap in product comparison is letting a manufacturer's feature list define what you value. Build your criteria independently - based on your actual use case - before you read a single product page. Once you've been exposed to a product's framing, it's psychologically harder to evaluate objectively.
What You'll Need Before Starting
This process works best when you already have a shortlist - typically two to four products - and basic access to their documentation. If you're still in the early stage of identifying candidates, build that list first.
What you will need
Spreadsheet or Comparison Grid
Organizes criteria, scores, and notes for each product in a single view to prevent information from being mentally juggled.
Manufacturer Spec Sheets
Provides standardized technical details to compare like-for-like across candidate products.
Independent Review Sources
Supplies real-world performance data and user feedback that marketing materials typically omit.
Notepad or Voice Memo App
Captures first impressions and gut reactions before they fade, useful during in-store evaluation or hands-on testing.
Use a Simple Spreadsheet
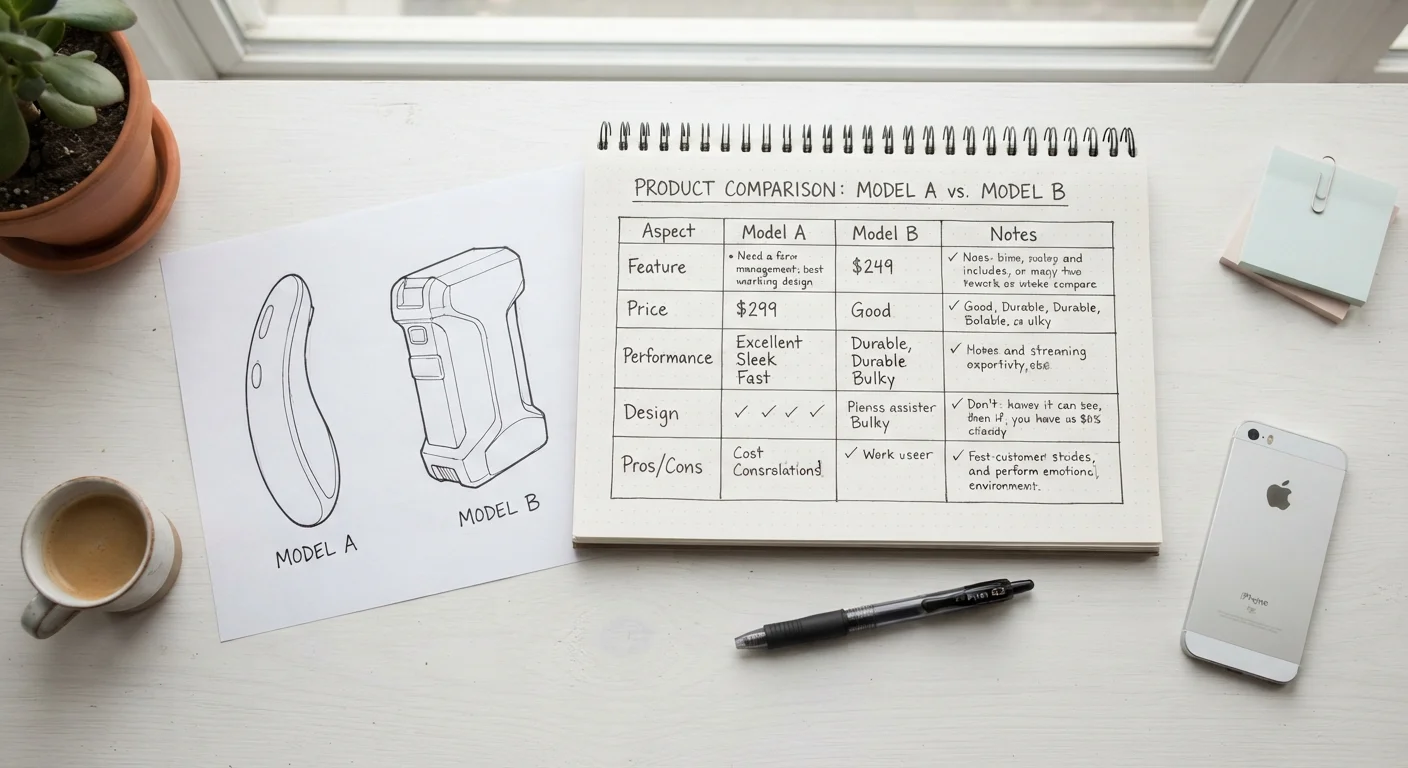
A basic spreadsheet with products as columns and criteria as rows is one of the most effective comparison tools available. It forces you to fill every cell - which quickly exposes which products have gaps in documentation or transparency. Even a rough version built in 10 minutes will outperform mental juggling for decisions over $100.
For purchases where in-person evaluation is possible, hands-on testing adds a layer of information that no spec sheet or review can fully replicate. Our guide to online research versus in-store evaluation explains how to use both methods together effectively.
The Step-by-Step Comparison Process
Follow these steps in order. The sequence matters: steps taken out of order - especially defining criteria after seeing product pages - undermine the objectivity the framework is designed to create.
Define your criteria before touching product pages
Write down what the product must do for you - not what any product is capable of doing. Think about your specific use environment, frequency of use, space constraints, and who else in your household will interact with it. Separate requirements into two buckets: must-haves (non-negotiable) and nice-to-haves (genuinely optional).
This step exists purely to protect you from being anchored to a manufacturer's framing. Doing it before any product exposure is what makes it valuable.
Assign weights to each criterion
Not all criteria are equal. Assign a simple weight to each one - a scale of 1 to 3 works well for most decisions (1 = somewhat important, 2 = important, 3 = critical). You can use percentages if you prefer precision.
Weighting prevents a trivial feature from swaying your final score. A product that excels in a low-priority area but underperforms on your top need should still rank lower - but without explicit weights, the math won't reflect that.
Build your comparison grid
Create a grid with your criteria listed as rows and each candidate product as a column. Add a row for weighted score at the bottom. Score each product on each criterion using a consistent scale - 1 to 5 is standard. Multiply each score by its weight, then sum the column for a total.
This isn't a perfect algorithm - it's a structured thinking tool. The purpose is to make your reasoning visible and revisable, not to produce a mathematically optimal answer.
Source data from independent, verifiable information
Fill your grid using manufacturer specs, independent testing publications, and owner feedback - in that priority order for technical claims. For lived-experience qualities (noise level, ease of assembly, durability after 12 months), owner reviews on verified-purchase platforms often surface what lab tests miss.
When reading reviews, look for patterns across multiple reviewers rather than isolated opinions. Our guide to evaluating product reviews explains what to look for in credible sources versus paid noise.
Flag any criteria where data is missing or unverifiable
If a product lacks documentation on a criterion you care about, mark it explicitly in your grid rather than leaving the cell blank or assuming a neutral score. Missing information is itself a data point - it may indicate limited transparency, a newer product without a track record, or a category where independent testing is sparse.
Watch for the warning signs covered in our guide to red flags in product listings, such as vague warranty terms or suspiciously uniform review language.
Review your scores and sense-check against gut feeling
Once totals are in, compare them - but don't automatically choose the highest number. Ask: does this result feel right? If it doesn't, examine which criterion weighting might be off, or whether a must-have you listed is really a deal-breaker in practice.
If the grid produces a clear winner that also passes your gut check, you have a decision with documented reasoning. If there's meaningful tension, the grid has at least shown you exactly where the trade-offs sit - which is more useful than vague indecision.
Beware of Specification Inflation
Manufacturers routinely highlight specifications that sound impressive but have little bearing on everyday performance. A camera's megapixel count, a blender's wattage, or a mattress's coil count may matter far less than how those numbers translate to actual use. Cross-reference specs with independent testing sources before treating any single figure as decisive. See our guide to reading spec sheets for help interpreting what the numbers actually mean.
Applying the Framework to Specific Categories
The steps above are category-agnostic, but a few adjustments help for common purchase types:
- Vehicles: Weight long-term ownership costs (insurance, maintenance, fuel) as heavily as purchase price. Reliability data from independent sources carries significant weight for a multi-year asset. See our vehicle selection hub for category-specific considerations.
- Appliances and electronics: Availability of replacement parts, length of manufacturer warranty, and brand support reputation deserve explicit criteria rows - these affect total cost of ownership materially.
- Health and wellness products: Prioritize independent testing certifications and peer-reviewed evidence over marketing claims. This is a category where the gap between claimed and demonstrated performance is often wide.
Once you've made a decision, the same documented reasoning that drove your comparison can inform your approach to finding genuine savings - knowing exactly which product you want prevents substitution pressure from clouding value judgments.